https://www.frontiersin.org/articles/10.3389/fgene.2017.00087/full
 |
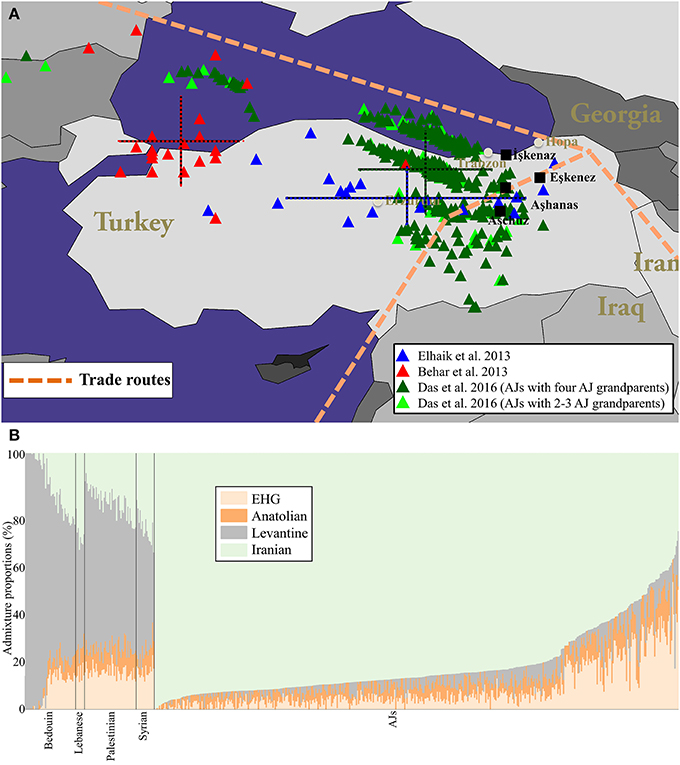
| Figure 1. The localization of AJs and their ancient admixture proportions compared to neighboring populations. (A) Geographical predictions of individuals analyzed in three separate studies employing different tools: Elhaik (2013, Figure 4) (blue), Behar et al. (2013, Figure 2B) (red), and Das et al. (2016, Figure 4) (dark green for AJs who have four AJ grandparents and light green for the rest) are shown. Color matching mean and standard deviation (bars) of the longitude and latitude are shown for each cohort. Since we were unsuccessful in obtaining the data points of Behar et al. (2013, Figure 2B) from the corresponding author, we procured 78% of the data points from their figure. Due to the low quality of their figure we were unable to reliably extract the remaining data points. (B) Supervised ADMIXTURE results. For brevity, subpopulations were collapsed. The x axis represents individuals. Each individual is represented by a vertical stacked column of color-coded admixture proportions that reflect genetic contributions from ancient Hunter-Gatherer, Anatolian, Levantine, and Iranian individuals. |